

Appearance
Usage insights
Usage insights is a dashboard that shows how you, and if you are an administrator your whole organization, use Nomain over time. It counts the chats you start, the messages you send, the Systems you work with, and the tokens your chat responses consume, then plots them on trend charts. Open it from Usage insights in the left sidebar.
Who can see what
The Usage insights page is available to every signed-in user for their own activity. The Organization view, which aggregates activity across everyone in your company, is available to tenant administrators only.
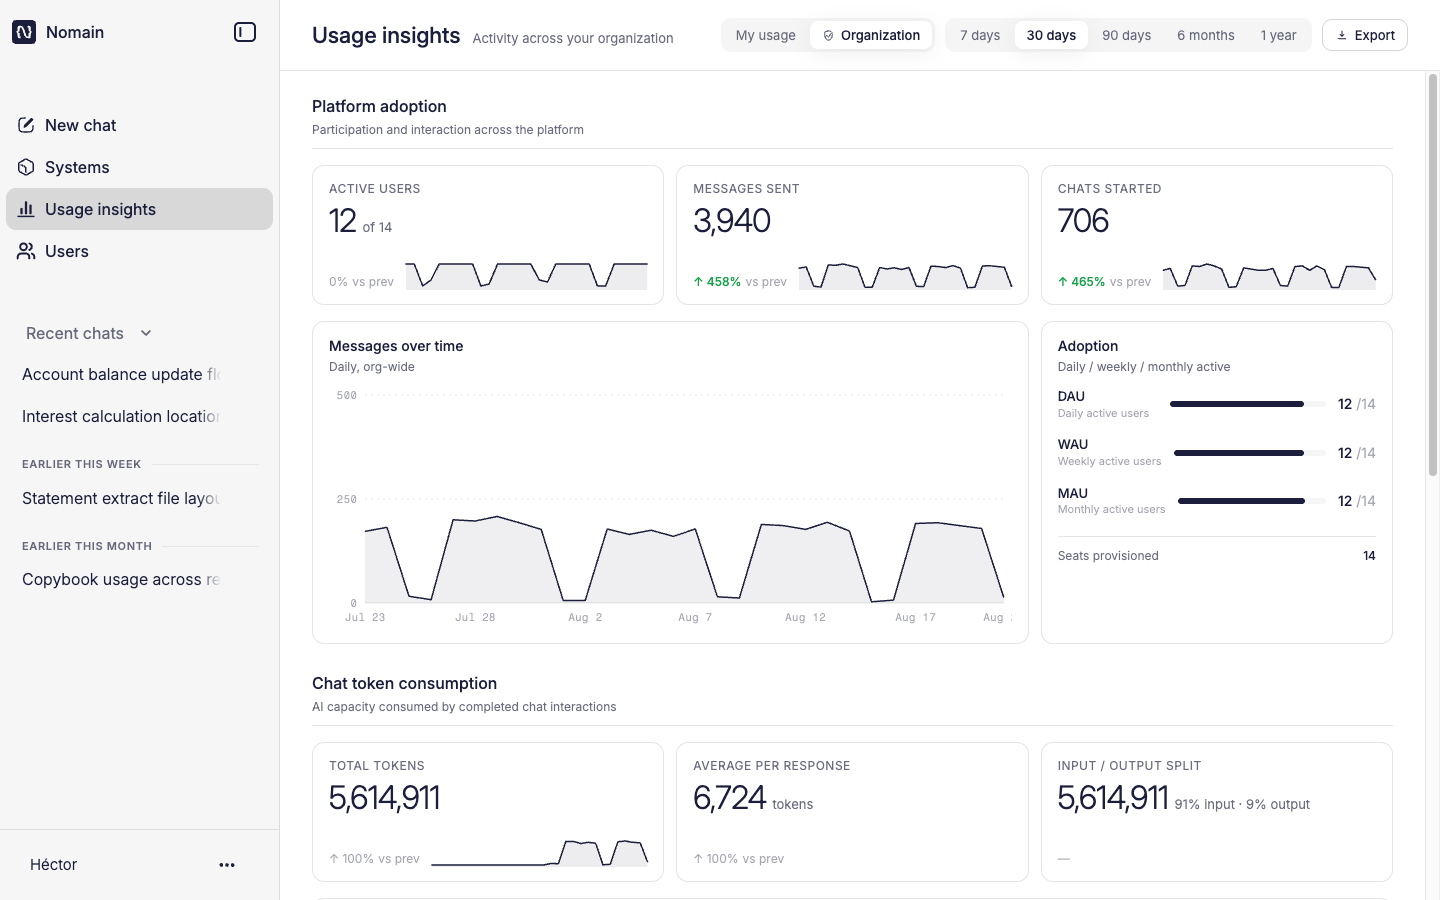
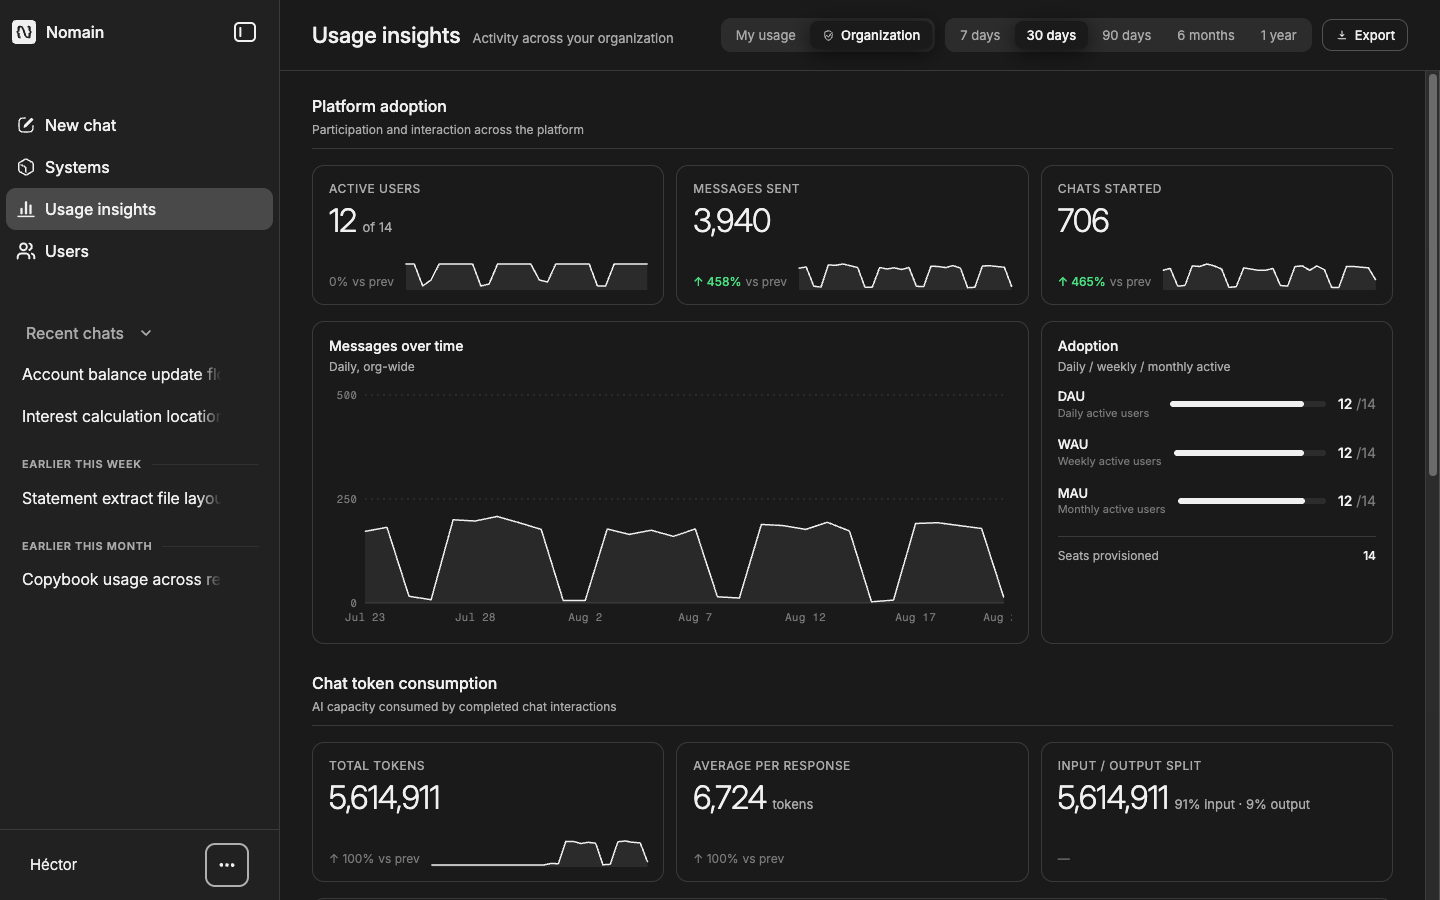
Screenshots on this page show a demo organization.
Headline numbers
Three tiles at the top show your key figures, each with an up/down percentage vs the previous period and a small trend sparkline:
- My usage: Chats started, Messages sent, and Systems touched.
- Organization (admins): Active users (shown as "N of M" seats), Messages sent, and Chats started.
Choosing a time window
Pick a range with the control at the top: 7 days, 30 days, 90 days, 6 months, or 1 year (the default is 30 days). The 7/30/90-day views are shown day by day; the 6-month and 1-year views are shown month by month.
The cards
| Card | What it shows |
|---|---|
| Messages over time | A line chart of message volume (your own, or org-wide). |
| Activity by day (My usage) | Total messages by weekday. |
| Adoption (Organization) | DAU / WAU / MAU, the distinct people active in the last 1, 7 and 30 days, against seats provisioned. |
| Top systems | The Systems you (or the org) use most, ranked by message volume. Click a row to open the System. |
| Top entities referenced | The specific programs, jobs and files the assistant surfaced most often in chats, each with a reference count. |
Token consumption
Every AI-generated chat response consumes tokens, and tokens are the main driver of AI cost. The token consumption view shows this for your own chats, and org-wide if you are an administrator: total tokens, split into input and output, the average per response, and a tokens-over-time chart. It follows the same time window you pick at the top, across every range.
Measured from introduction onward
Token figures accumulate from the moment this feature was introduced; earlier responses are not measured retroactively. Instead of silently understating early usage, the view tells you how many responses the figures are based on.
Exporting the data
Click Export (the download icon) to save the underlying time series as a CSV file (columns: date, messages, chats, graphs, chat_tokens), named like usage-insights-me-30d.csv. The export covers the trend series, not the top-systems or top-entities cards.
How the numbers are kept current
Figures are recomputed automatically each night from stored daily and monthly rollups, and today's activity is added live so the page always reflects the current day. A "last updated" timestamp is shown, and message counts include AI-generated messages, not only what you typed. The page states this in its disclaimer.
Empty and loading states
When there is no activity in the selected window, the charts show "No activity in the last <range>" instead of an empty graph. While data loads, you see shimmer placeholders.
Related
- Chat: the activity these metrics measure.
- User management: where seats and users come from (admins).