

Appearance
Graph visualization
The System map is an interactive picture of one of your software systems. Each dot (a node) is a real building block found in your code, such as a program, a file or data definition, a batch job, a copybook, a screen map, or a field. The lines between dots (edges) show how those parts connect and depend on each other.
The map sits next to the chat: when you ask a question, the parts referenced in the answer light up on the map. It is built for exploring and understanding a large mainframe codebase visually, not for editing it.
What you see
You start with an overview of the whole system, with the major building blocks laid out across the canvas. Node colors group parts by category, for example:
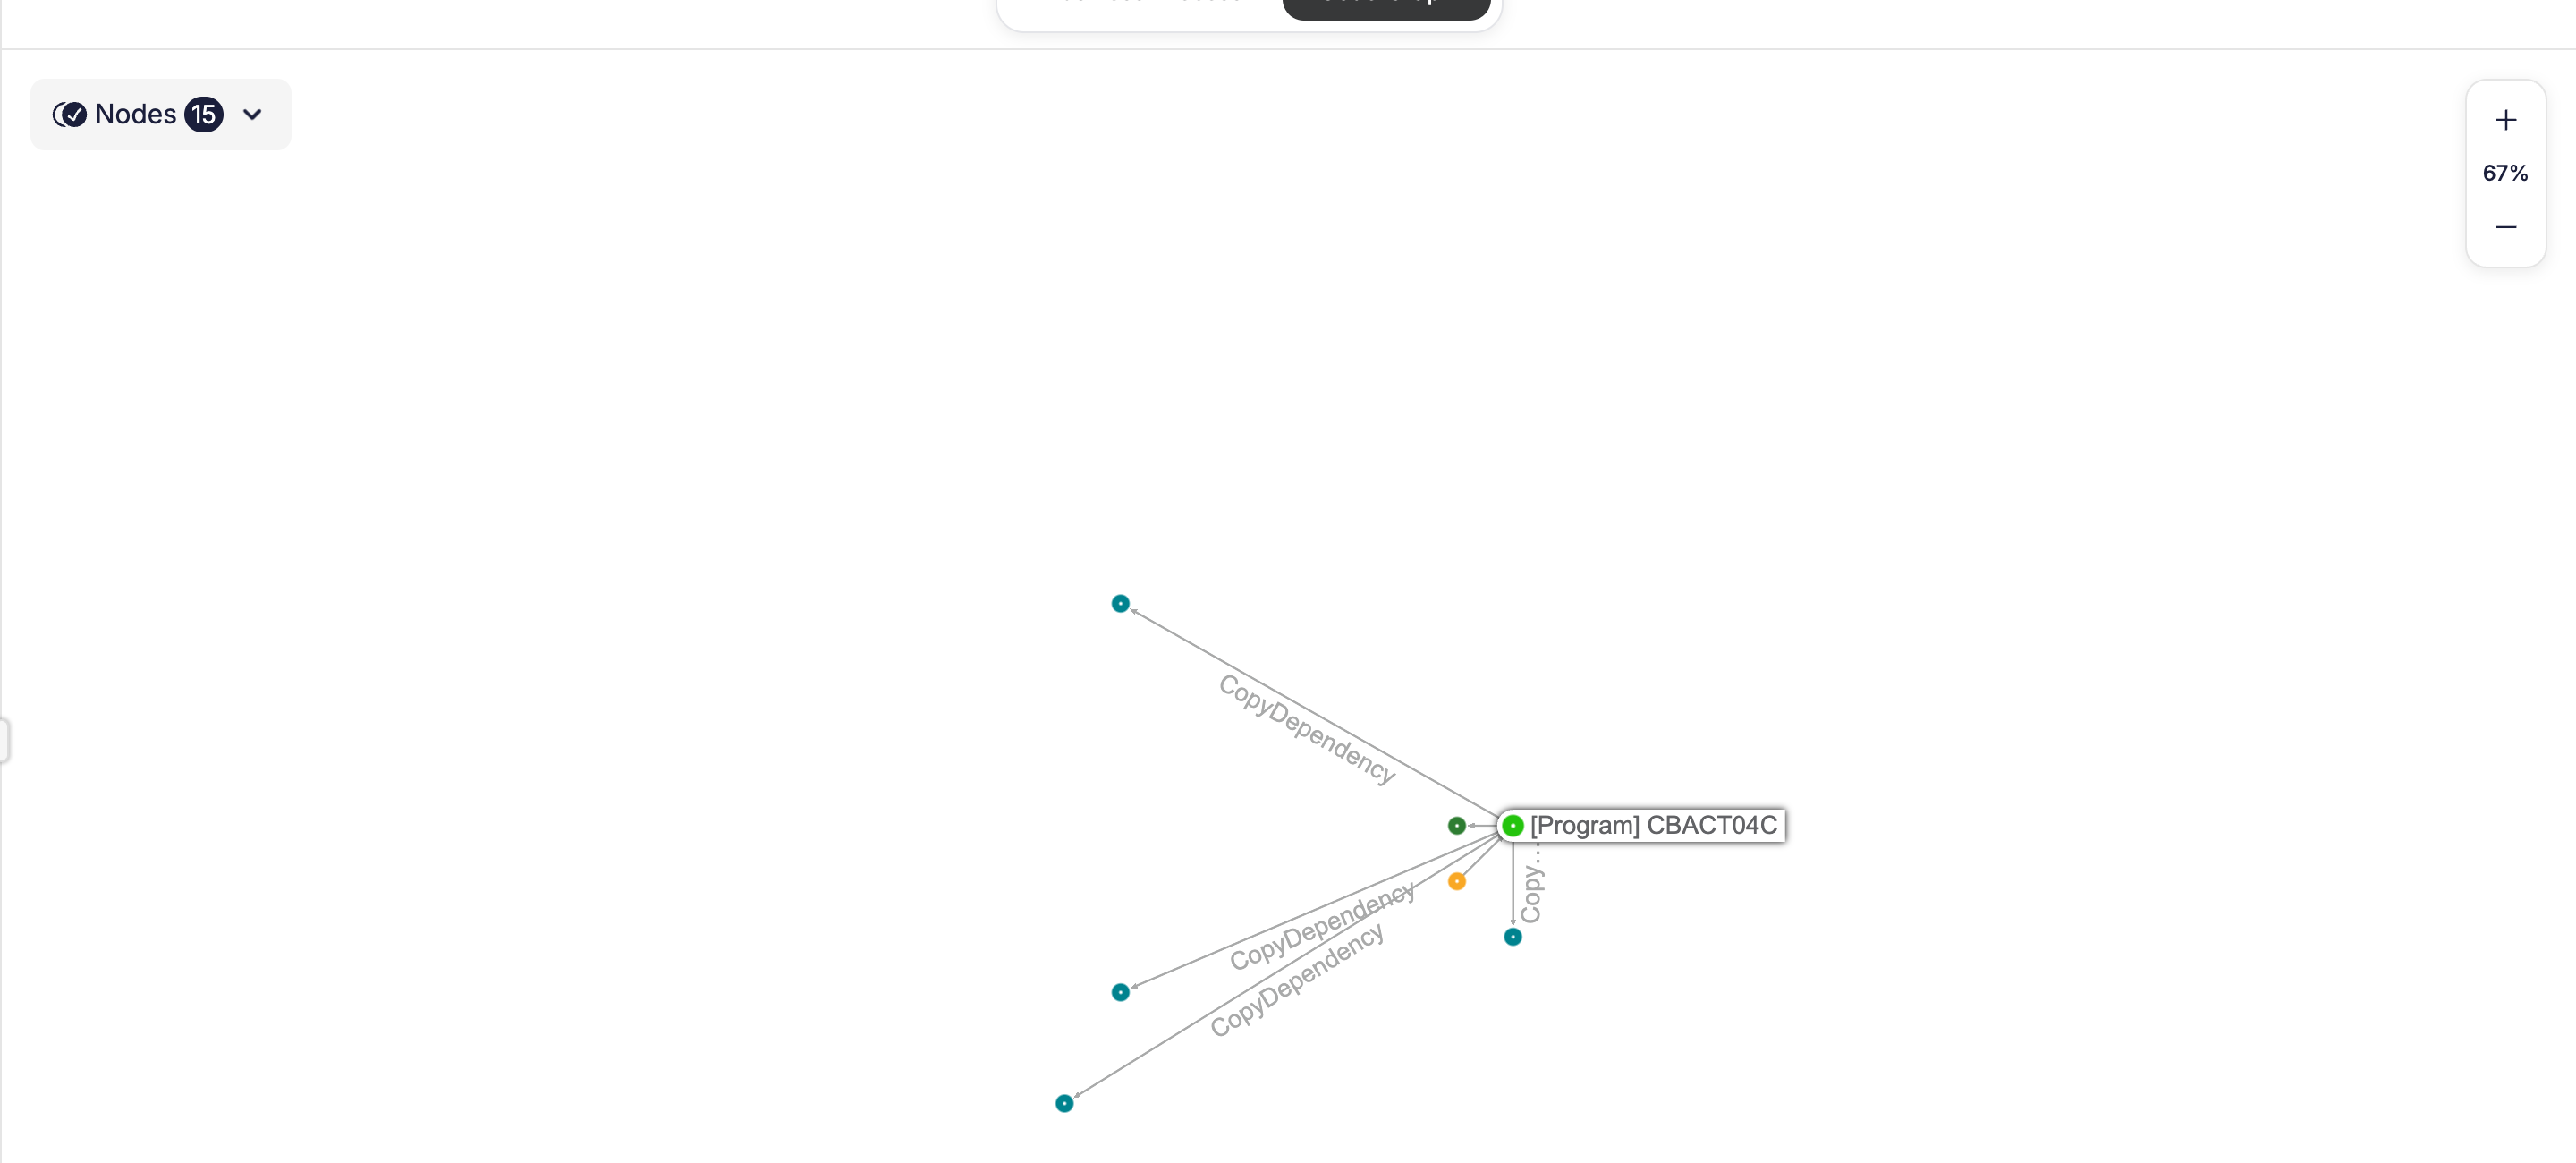
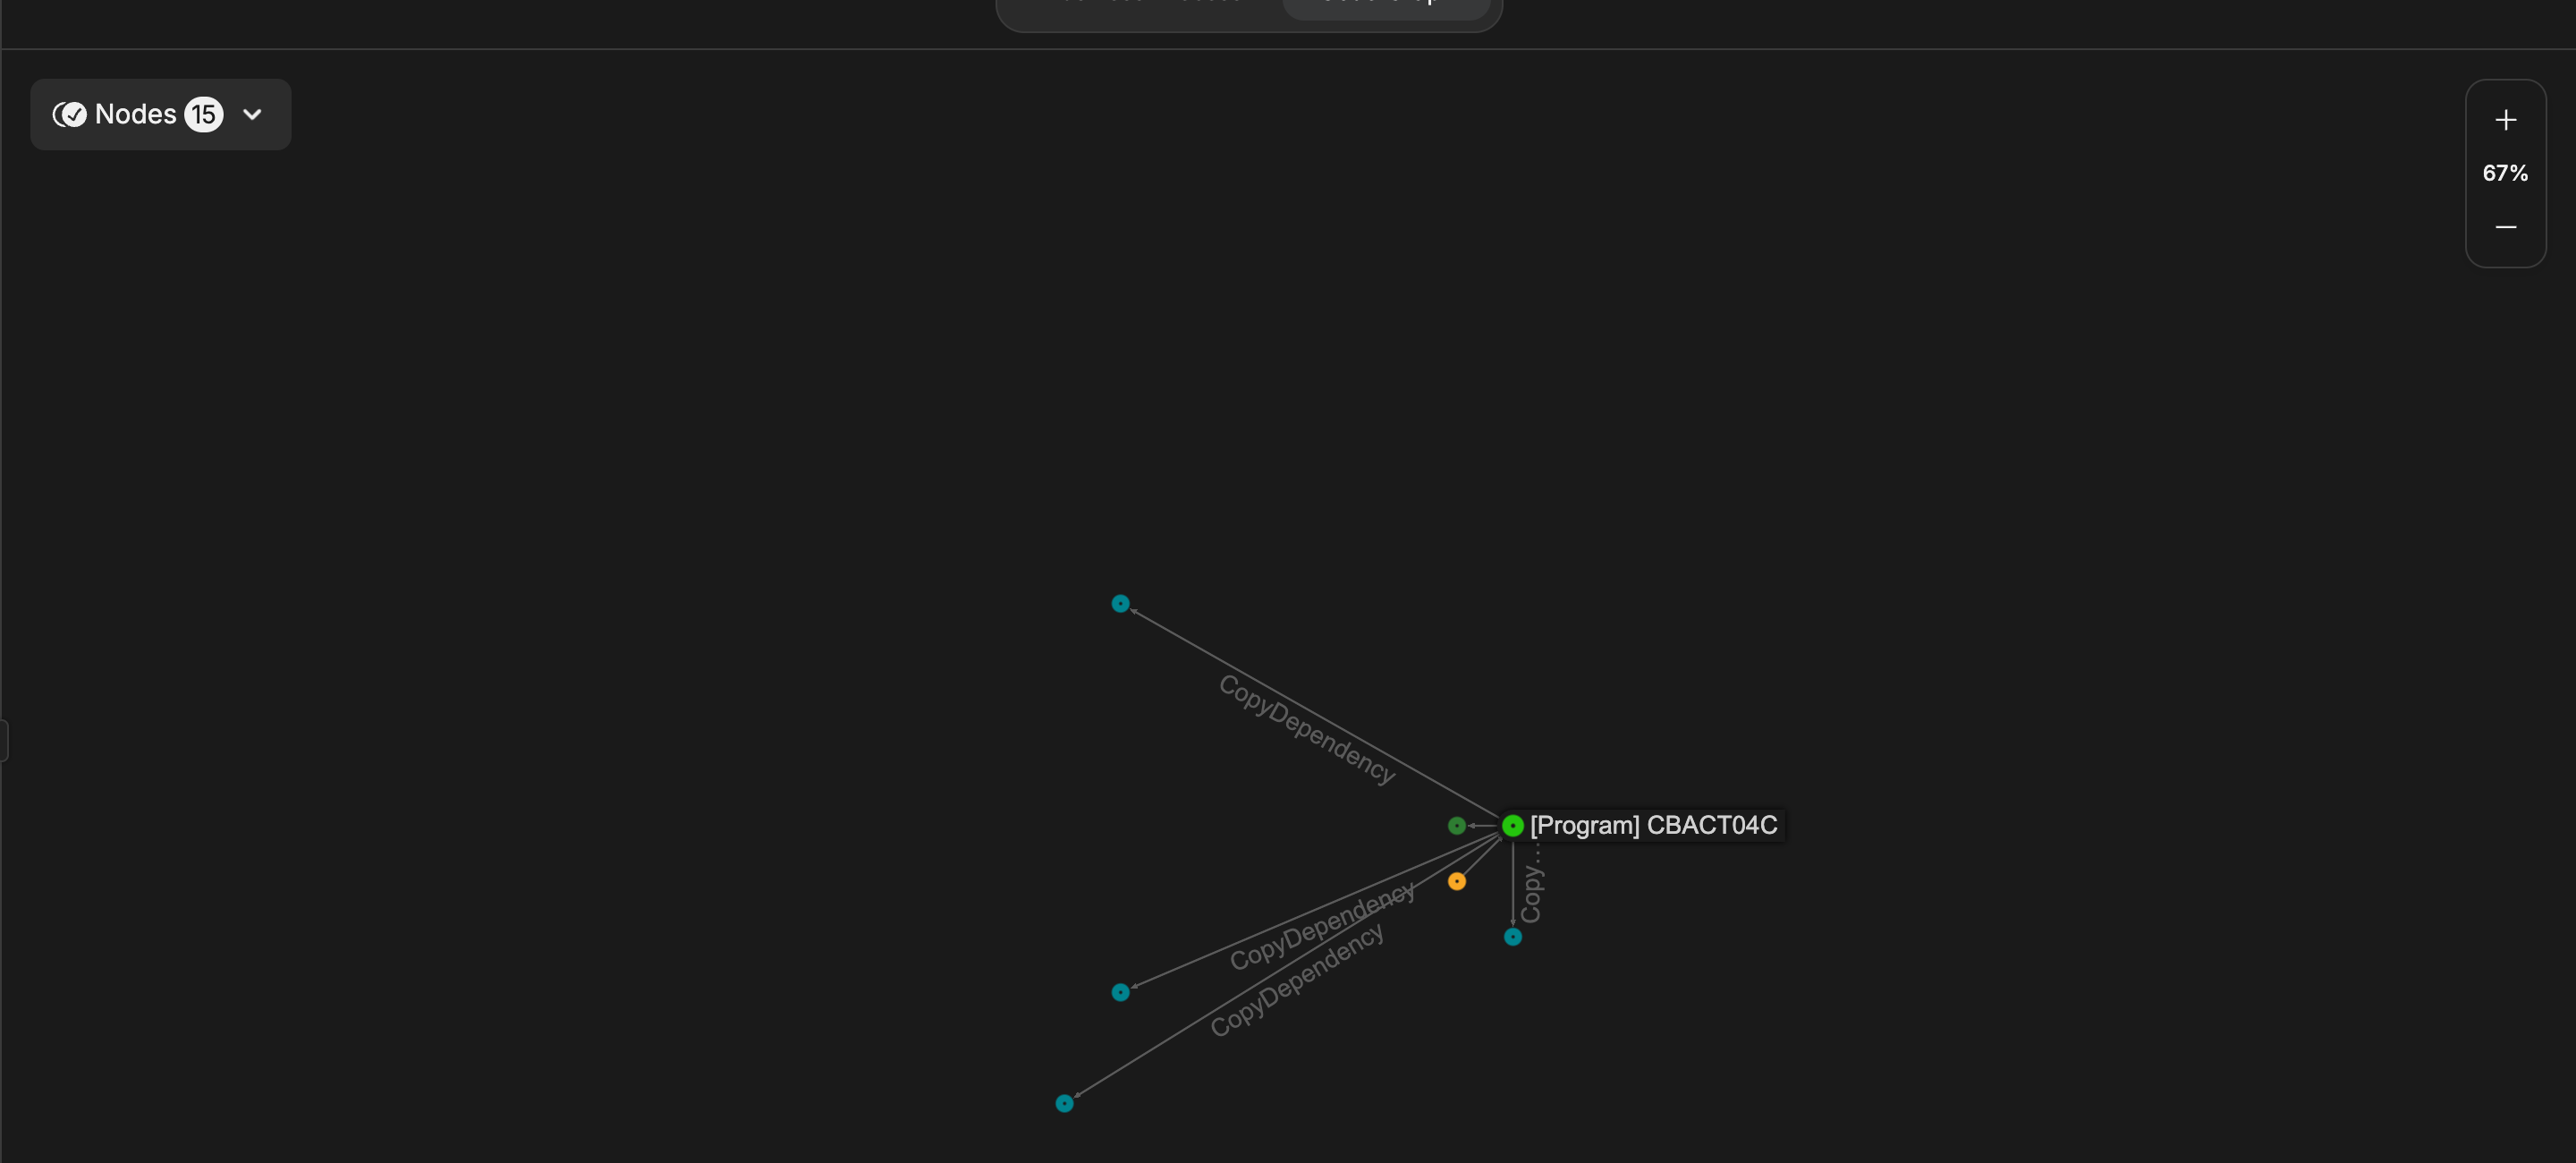
| Category | Color family |
|---|---|
| Programs, copybooks, paragraphs | Green |
| Screens & maps | Blue |
| Jobs & steps | Yellow / orange |
| Files & data | Cyan |
| CICS commands | Orange / red |
Exploring the map
- Select a part: click its dot. It highlights, and a details panel opens with an explanation and a Node Info tab.
- Drill into a program: with a top-level part selected, click the Zoom In button that appears just below it to open its internal detail view (paragraphs, data definitions, and so on).
- Return to the whole system: in a detail view, click the back arrow at the top-left. The part's name shows next to it as a breadcrumb.
- Change the internal layout: in a program detail view, use the layout button at the top-right to choose Hierarchical or Circular.
- Zoom and pan: use the plus/minus buttons (the current zoom percentage is shown between them), or drag the canvas.
- Clear a selection: click empty space to deselect and remove highlights.
Filtering what's shown
Open the Nodes control to choose which kinds of parts appear:
- Tick or untick node types, or use Select all.
- Use the Find filter box to search the list of types.
- A badge shows how many types are currently selected, and a small color swatch sits next to each type.
Progressive exploration
Inside the Nodes filter panel is a Progressive toggle. When on, the map starts empty and reveals only the parts referenced in your chat answers, so you explore a few pieces at a time instead of seeing everything at once. Its tooltip explains: "Hides all graph nodes initially. As you chat, only the nodes referenced in responses become visible for focused exploration." Your choice is remembered per chat.
Node details
Selecting a part opens the details panel, which can include:
- An explanation of what the part does.
- A Dead Code Analysis tab, when the part contains code that appears unused.
- A Node Info tab with facts about the part: its Identifier, Kind, Source file (with a repository chip), Lines, and Language.
Click an entity name inside an explanation to highlight the matching part on the map. If a node has no extra detail, the panel says so rather than showing an empty box.
Under the hood
The map is drawn in your browser and laid out with a force-directed algorithm so related parts cluster together. The layout is automatic; there is nothing to configure. Some interactions (like the Zoom In drill-down) may vary slightly by deployment.
Related
- Chat: the map lives next to the conversation and lights up with each answer.
- Business processes: the same System seen in business terms, switchable from the code graph.
- Systems: the model the map visualizes.